This section describes a Visual Basic program which will connect to the BRTOS running on a PIC 18FXX2 series processor. The program is used for establishing which tasks are currently in the task list, monitoring when tasks are actually run and can provide an indication of the processor loading.
I have made this program available as a standard Visual Basic setup this ensures all the DLLs and OCX files are correctly installed together. In addition there is a Plug-in installation program to integrate it with the IDE. The program is supplied as is with absolutely no guarantees or warranties use it at your own risk. It was developed on an Athalon 64 processor under Windows XP Service Pack 2 using Visual Basic Version 6 Service pack 6.
I have not been able to test the installation on a virgin machine (i.e. one without a previous installation of VB so I cannot be sure it installs all the DLLs and OCX files correctly)
Thats the caveats out of the way heres the User Guide:
To start task monitor, load and select the program you wish to monitor in the IDE and select Task Monitor from the Plug in Menu.
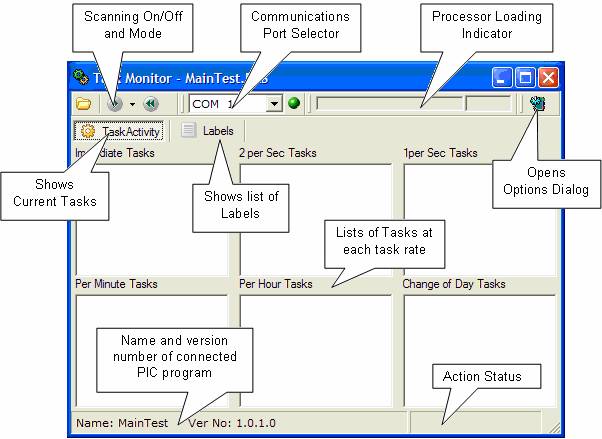
The screen above shows the Task Monitor connected via COM 1 to the PIC. It has interrogated the PIC and reported back the PIC Program Name and Version number.
|
|
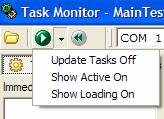
Click Click Select from the drop down menu which activities to monitor |
|
|
Communications port selection Use this control to select alternative Com ports or Network connections. (These have to be set up
initially from the |
|
|
|
When the Task Monitor is opened it will load in the source file of the program currently selected in the IDE and the list file from the corresponding assembly and will extract all the Labels and their respective addresses. Clicking on the Labels tab will show the labels, the files in which they were referenced, and their absolute address.
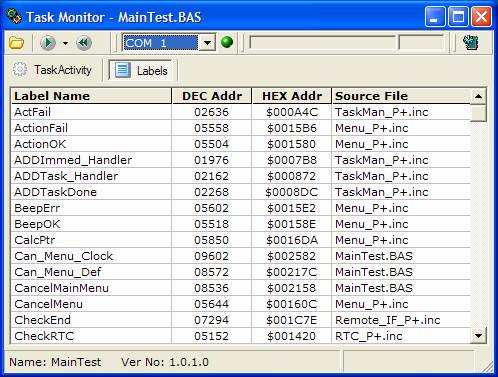
(Note the program will open up all include files as well as the main source file. If the current file in the IDE had not been compiled the program will open up without loading in the labels. You can manually select the Proton source file from the File menu)
Clicking on any column will re-sort the display by that column.
The Task Monitor uses the table of labels versus address to translate the label addresses being returned by the PIC into meaningful label names which you can relate back to your Proton source.
The options Dialog allows you to set up the configuration of the Serial Comm port and/or any network connections and enable message logging and label filtering.
You can edit or delete existing connections or add a new connection.
|
|
To edit an existing network connection, click the connection in either list box below. The details will be copied into the top edit box where it can be edited. When editing is complete click the Done button. To delete an existing network connection, click on the connection in either list box below then click Delete. To add a connection Click Add, if an existing connection is highlighted it will be copied into the Edit boxes and copied to the list. You should then treat it as an edit. |
|
|
Hide False Labels will hide certain unresolved label references. Leave checked |
Logging On will add an additional Tab to the main screen showing all sent and received messages from the time logging was enabled. |
|
NOTE You can only modify the connection when the Task Monitor is not scanning the activities of the PIC application.
Clicking on OK will update any changes you have made and return you to the Main Screen.
Clicking on Cancel will ignore any changes you have made and return you to the Main Screen.
The Logging screen shows the messages passing between the PC and the PIC. The top part of the screen shows the messages from the PC the bottom part, messages received by the PC.
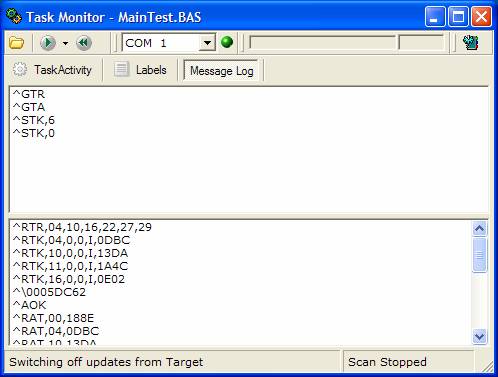
You can drag the centre bar up and down to adjust the size of each section
Right click in either box to access a menu to clear the messages, select all messages and copy highlighted messages to the clipboard
Here you can see the Task Monitor in action reporting the activities of the Task Manager.
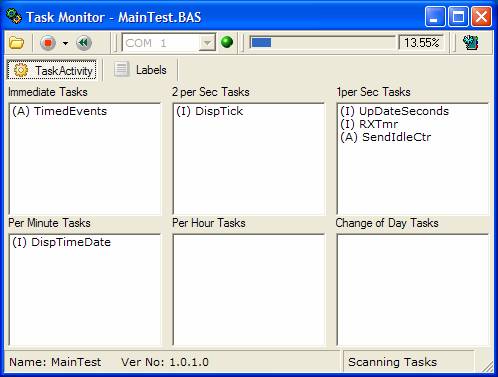
NOTE With all three monitoring options active the comms becomes pretty active and if you have a program which is rapidly swapping tasks in and out of the task list you could find that more time is spent reporting the state rather than executing the program and eventually things will grind to a halt.
At present with all 3 activities running and the clock application, my 20MHz PIC is only running at around 8% loading. In fact this comes down when you reduce the monitoring. So as you can see the operating system per se is not producing an unacceptable overhead.